Energy community demo scenario
Simple energy community (EC) demo scenario that is used as a SimCES simulation platform test case: Running the EC demo scenario
Description
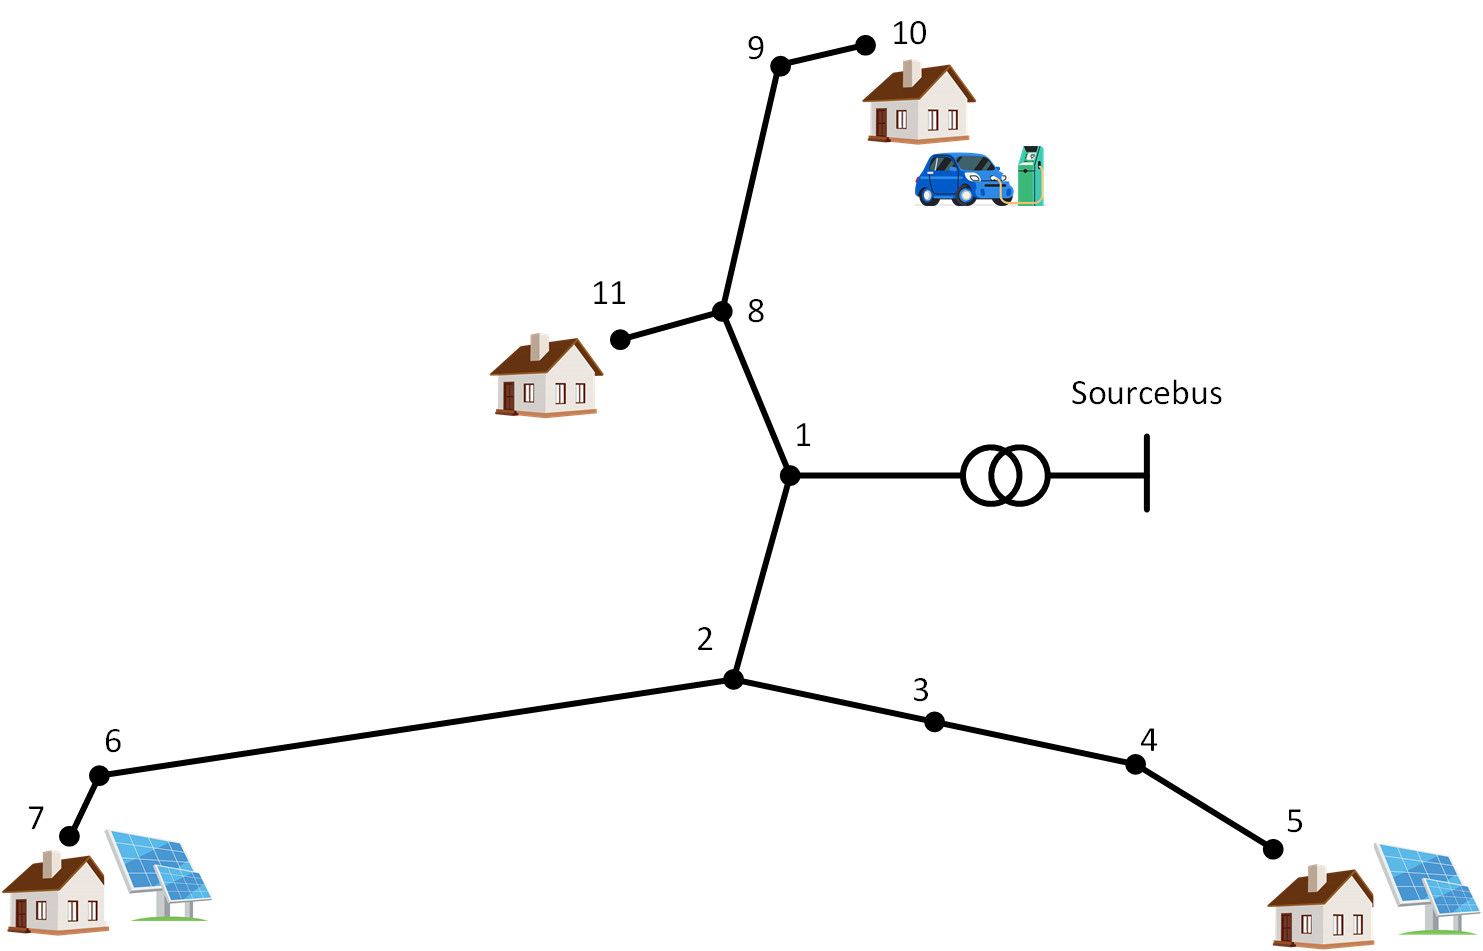
This scenario describes the behavior of a small rural energy community of four detached houses. The houses have no controllable loads or storages but two of them have a small scale PV (photovoltaic) systems installed and one has a electric vehicle charging. Scenario spans over one day with hourly resolution (epochs).
Scenario setup is depicted on image below. The scenario network has 12 buses (Source + 11 others) where houses are connected to buses 5, 7, 10 and 11. Houses at buses 5 and 7 have the PV generation and the house at bus 10 has the EV charging.
Load and generation timeseries
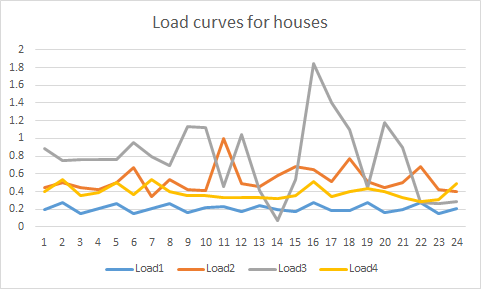
Load curves (i.e. the hourly energy demand) of the houses are depicted in figure below for the scenario time period. Houses at buses 5, 7 and 11 have moderate consumption throughout the day whereas the house in bus 10 has relatively higher consumption that increases at afternoon.
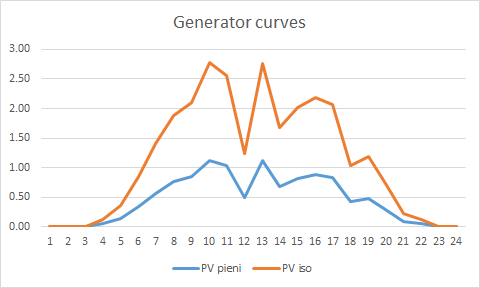
Generation for the two PV systems is depicted in figure below. The smaller system is connected to bus 5 and the larger one to bus 7. generation profile shows sunny morning with intermittent cloud coverage around noon.
The data for the demo scenario in CSV files can be found at https://github.com/simcesplatform/Platform-Manager/tree/master/resources. The given CSV files are compatible for use with the Static time series resource component in simulation runs.
Epochs
| Epoch # | Start time | End time |
|---|---|---|
| 1 | 2020-06-25T00:00 | 2020-06-25T01:00 |
| 2 | 2020-06-25T01:00 | 2020-06-25T02:00 |
| 3 | 2020-06-25T02:00 | 2020-06-25T03:00 |
| 4 | 2020-06-25T03:00 | 2020-06-25T04:00 |
| 5 | 2020-06-25T04:00 | 2020-06-25T05:00 |
| 6 | 2020-06-25T05:00 | 2020-06-25T06:00 |
| 7 | 2020-06-25T06:00 | 2020-06-25T07:00 |
| 8 | 2020-06-25T07:00 | 2020-06-25T08:00 |
| 9 | 2020-06-25T08:00 | 2020-06-25T09:00 |
| 10 | 2020-06-25T09:00 | 2020-06-25T10:00 |
| 11 | 2020-06-25T10:00 | 2020-06-25T11:00 |
| 12 | 2020-06-25T11:00 | 2020-06-25T12:00 |
| 13 | 2020-06-25T12:00 | 2020-06-25T13:00 |
| 14 | 2020-06-25T13:00 | 2020-06-25T14:00 |
| 15 | 2020-06-25T14:00 | 2020-06-25T15:00 |
| 16 | 2020-06-25T15:00 | 2020-06-25T16:00 |
| 17 | 2020-06-25T16:00 | 2020-06-25T17:00 |
| 18 | 2020-06-25T17:00 | 2020-06-25T18:00 |
| 19 | 2020-06-25T18:00 | 2020-06-25T19:00 |
| 20 | 2020-06-25T19:00 | 2020-06-25T20:00 |
| 21 | 2020-06-25T20:00 | 2020-06-25T21:00 |
| 22 | 2020-06-25T21:00 | 2020-06-25T22:00 |
| 23 | 2020-06-25T22:00 | 2020-06-25T23:00 |
| 24 | 2020-06-25T23:00 | 2020-06-26T00:00 |
All times are given in Finnish local time (EEST).
Network model (for State Monitoring)
- VB = 400 V, SB = 50 kW.
- All values in pu.
- Positive sequence only.
Branch
| Name | SE bus | RE bus | R | X | Y | G | IRATED |
|---|---|---|---|---|---|---|---|
| T1 | SourceBus | 1 | 0.072 | 0.134 | 0 | 0.00256 | 1.73913 |
| L1 | 1 | 2 | 0.056 | 0.008 | 0 | 0 | 1.12 |
| L2 | 2 | 3 | 0.084 | 0.007 | 0 | 0 | 0.72 |
| L3 | 3 | 4 | 0.054 | 0.006 | 0 | 0 | 1 |
| L4 | 4 | 5 | 0.064 | 0.005 | 0 | 0 | 0.72 |
| L5 | 2 | 6 | 0.249 | 0.038 | 0 | 0 | 1.12 |
| L6 | 6 | 7 | 0.143 | 0.002 | 0 | 0 | 0.624 |
| L7 | 1 | 8 | 0.016 | 0.002 | 0 | 0 | 1.12 |
| L8 | 8 | 9 | 0.074 | 0.011 | 0 | 0 | 1.12 |
| L9 | 9 | 10 | 0.077 | 0.006 | 0 | 0 | 0.72 |
| L10 | 8 | 11 | 0.001 | 0.000 | 0 | 0 | 0.8 |
Bus
| Name | Type |
|---|---|
| SourceBus | SLACK |
| 1 | DUMMY |
| 2 | DUMMY |
| 3 | DUMMY |
| 4 | DUMMY |
| 5 | PQ |
| 6 | DUMMY |
| 7 | PQ |
| 8 | DUMMY |
| 9 | DUMMY |
| 10 | PQ |
| 11 | PQ |